PoliVisu kick-starts its training program with a webinar on data challenges
- May 20, 2020
- 3 min read
PoliVisu's ambitious training programme designed to make policy process more agile through advanced analytics and visualisations was launched 19 May 2020 with a webinar on data challenges. More than 40 individuals ranging from students to CEOs joined the live stream to learn about the experience of three PoliVisu pilot cities in addressing these challenges.
After a brief introduction by the moderator (Pavel Kogut), representatives of local and regional administrations presented their use cases to the audience.
The Ghent Case Study
Freya Acar of Stad Ghent gave an overview of the Ghent pilot which focuses on student mobility. In order to reach a healthy mix of student houses and family homes, the city had to obtain data on student locations. However, no central register containing such information exists. Moreover, higher education institutions have been reluctant to share student addresses for fear of legal consequences. To solve the problem, Ghent has been cooperating with Proximus to identify student lodgings based on anonymised telecoms data. The end result has been a heatmap showing where students live at different time periods e.g. during the day and at night, during the academic year and Christmas holiday.

A heatmap of student locations in Ghent created with QGIS
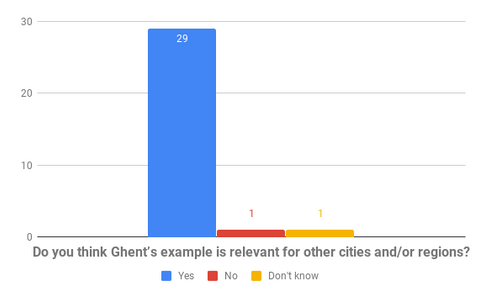
After the presentation, the audience provided instant feedback on the most interesting part of the case study, which was the data collection process as it resonated with the majority of respondents (61.3%). Also, almost everyone (94%) agreed that Ghent's example is relevant to other cities and/or regions


The Mechelen Case Study
The next speaker was Lieven Raes of Informatie Vlaanderen who presented the Mechelen case study which focuses on school streets. A school street is a street that is closed to traffic when children go to/from school. Before introducing a new school street in Mechelen, local policy makers wanted to know the effect of road closure on traffic in nearby streets. Some data was already being collected as part of the citizen science project Telraam, but it lacked integration with other relevant sources (e.g. weather information, school holidays), as well as pre- and post-measurement statistics, to be useful for policy making. The solution that PoliVisu helped develop is a policy dashboard which connects multiple data sources and visualises them in an engaging, easy-to-understand way.

The Mechelen dashboard which uses citizen science data, among others
Following the presentation the audience was asked to vote on the most interesting part of the Mechelen case study. For the majority of respondents (62%) it was the co-creation element whereby citizens provide traffic data by installing sensors in their homes. 93% said the case study was relevant to other cities/regions.


The Issy-les-Moulineaux Case Study
The final speaker was Matteo Satta of Issy Media. In his case study he presented the challenges that Issy-les-Moulineaux has faced following the launch of an ambitious metro extension project Grand Paris Express. The city wanted to know the impact of new roadworks and construction projects on local traffic conditions, but it didn't have the required data nor the tool to visualise it. The first challenge was tackled by obtaining car floating data from private companies. The second one by working with PoliVisu partners on the development of Issy Mobility Dashboard, which uses historical data to provide comparative analysis of traffic conditions.

The Issy Mobility Dashboard based on car floating data
A poll launched at the end of the presentation showed that most participants (43%) find the approach (i.e. public-private agreements) taken by the city very interesting and useful, and almost everyone (92%) agreed that lessons learned would be relevant to other cities and/or regions.


After the third presentation a brief Q&A session ensued.
The webinar ended with a quick overview of the Toolbox which, in addition to case studies, contains a lot of useful guidance for cities looking to improve their policy making process.


Comments